![]()
Most often than not, one builds a dashboard that is rendered based on some selection of date (from filter). When it comes to data based on discrete dates, there are use cases when we want to see the data / graph that is pertaining to the most recent / latest date. It is very easy to put the date as filter (and show it as a dropdown) in Tableau. And we can chose the latest date, and publish the dashboard.
The challenge comes in, when we automate the same report, and the underlying data gets refreshed at certain intervals, with data for new dates coming-in. Even though the underlying data gets refreshed, the date filter that we published retains the same value (that it was given) when the dashboard is published, and doesn’t pick the most recent date in a straight-forward way. So, the tableau shows the data for the date that was chosen in the filter when it got published, and the end-user needs to choose the date filter again to the recent date to display the new information.
And it’s not tableau’s issue, because it could very is, a valid use case to want the filter to show the same as what it was published (and not change to most recent date).
The below trick helps to achieve that result – getting the latest date in the date filter after the tableau data extract is done!
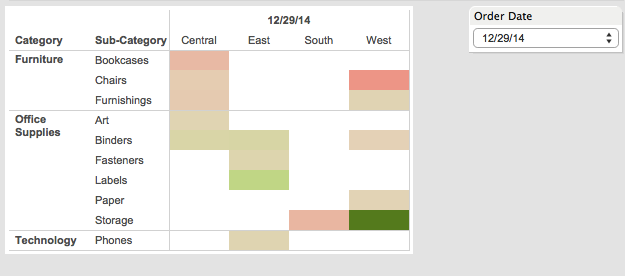
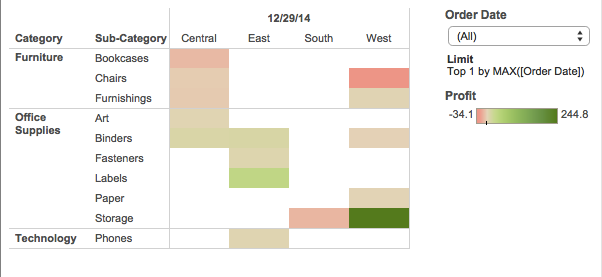
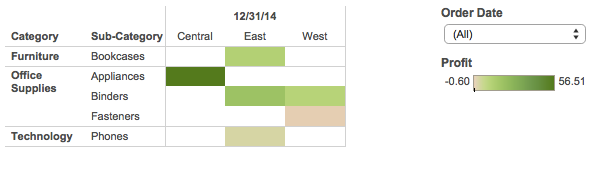
Example Illustration from Sample – SuperStore data: Say, you are looking at ‘Profit’ data (Green Profitable, Red – NOT) across region by Categories, and want to see the latest data.
You create the dashboard and publish it with latest date (say 12/29/2014) chosen in filter.
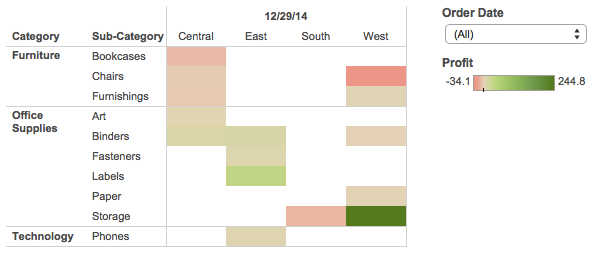
And once the underlying data gets refreshed the next day, 12/30/2014, your dashboard still shows data for 29th, and you need to change the filter to 30th, to see 30th data (As below). 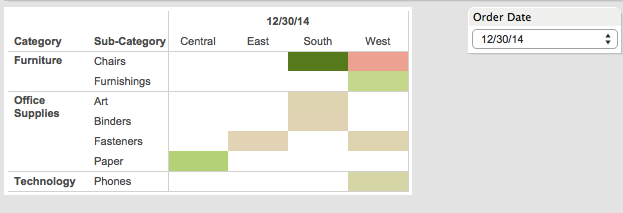
But you want the dashbaord to automatically update to recent/latest date, so the end-user can see that day’s data right away without the additional filter selection.
To do so, follow the below steps.
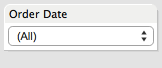
- Change the order date filter to ‘All‘
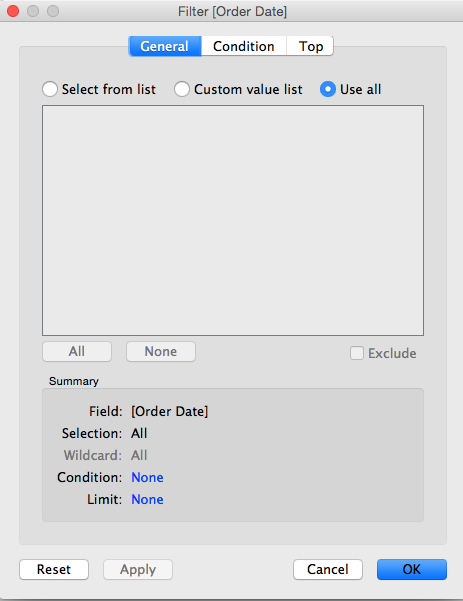
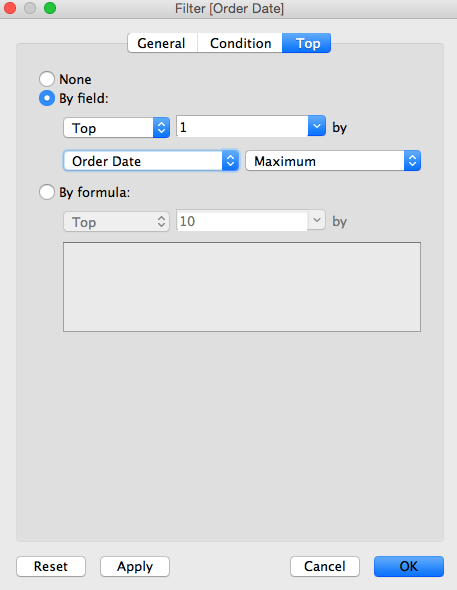
- Right-click on ‘Order Date’ filter pill to get it’s options, and in ‘General’ tab- choose ‘Use all‘, and in ‘Top‘ tab, choose as shown below, and click ‘ok’.
That’s is all there to it.
You can drag the sheet to Dashboard.
If you don’t want the limit (top1) to show up, you can simply reduce the size of the filter to have it hidden (from end-user)
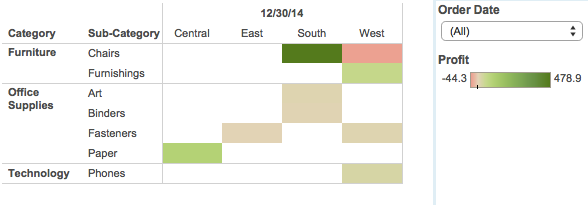
Now, when new data for dates 12/30 and 12/31 comes in, the dashboard gets updated automatically (as shown below). The filter remains the same as ‘All’, as soon as the end-user comes to this dashboard, they can see the latest data.
And this is one way to select Latest Date by Default in Discrete Date Filter.
Hope that helps !
![]()
